MA TREND SG
Today we investigate the freeware indicator called MA TREND SG.
Please see the picture bellow.
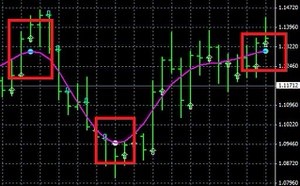
This is the capture of the chart from EURUSD Daily. (It is hard to see candles so I changed the setting to bar chart).
Blue circles show the trend reversals to SELL, white circles show the trend reversals to BUY.
*The red squares are painted by me.
I must say that this indicator draws the trend reversals quite correctly. As for yesterday, yes it finished with the blue (SELL) circle…!
I believe the fake signals increase with lower timeframes but if you follow the market trend this indicator could help us a lot to see the points of market reversals.
I have never heard of this indicator until now but I must say this looks promising!
You can download it from here; MA TREND SG
Trying the indicator as a prototype EA
I am not sure how many times I had thought ‘promising’ about any strategies, indicators, expert advisors but ended ‘complete fakes’… You never know the truth until you see any real reviews of real usage or try them by yourself.
I have developed an EA with conditions; to open entry on next tick after the circle, to close it with the reversal signal. The result was PF 0.8 on H1 timeframe.
On the visual mode, several opening and closing entries were done when there were no circle, I saw also that no entries were opened even though there were circles drawn. This is pretty weird…
On the other hand this strategy had terrible result on a range-bound market.
Investigation of the prototype EA on the demo account
As a next step, I have tried to investigate its performance on a demo account. I saw that the circle was eliminated after the new movement. I also saw that the circle was jumped to the three bars before. It means that this indicator makes “repaint”…
It seems that this indicator does not fix anything before confirming four bars so this could be the reason of repaint but…
Parameters
The parameter P = 4 – a period moving average.
Timeframes for H4 and D1 the value of P can be less than 4,
Timeframes for M30, M15, M5, M1 P value can be greater than 4.
Parameter PriceConstants – a method of calculating the price in the indicator.
You can change the prices in the indicator calculation of the indicator using PriceConstants:
PriceConstants = 0 – PRICE_CLOSE – Closing Price
PriceConstants = 1 – PRICE_OPEN – Open
PriceConstants = 2 – PRICE_HIGH – Maximum price
PriceConstants = 3 – PRICE_LOW – Lowest price
PriceConstants = 4 – PRICE_MEDIANL – Median price, (high + low) / 2
PriceConstants = 5 – PRICE_TYPICAL – Typical price, (high + low + close) / 3
PriceConstants = 6 – PRICE_WEIGHTED – weighted average price, (high + low + close + close) / 4
The parameter P is where we can configure the number of the bars for moving average, PriceConstants is the parameter of the method to calculate the price of this indicator.
H4 or Daily could be ok with a number equal or smaller than 4. M30 and shorter timeframes could use a number equal or bigger than 4.
In my case, I have used it by H1 and M5, for example, when the trend directions of each timeframes coincided an entry shall be opened. (Also I use support range and a criteria to analyze if the market is range-bound or not).
I could see that the appropriate P number is 6 as for M5. (H1 is ok with the default).
In any case, this indicator has no chance as an EA unless you combine with other excellent whatever strategies but I must admit that visually it could draw positive signals.
I believe this indicator could be useful to see the potential of the trading hour (for example London to NY), if the market is range-bound, if the trend is strong, if there is any supporting line or resistance line, etc-etc. I think I am going to use MA TREND SG for my MT4 Terminal, I’m sure it would help me for my manual trades on Forex.
 Business Calendar